SAI Groups
Customer Traffic Shape of Day
Detailed view
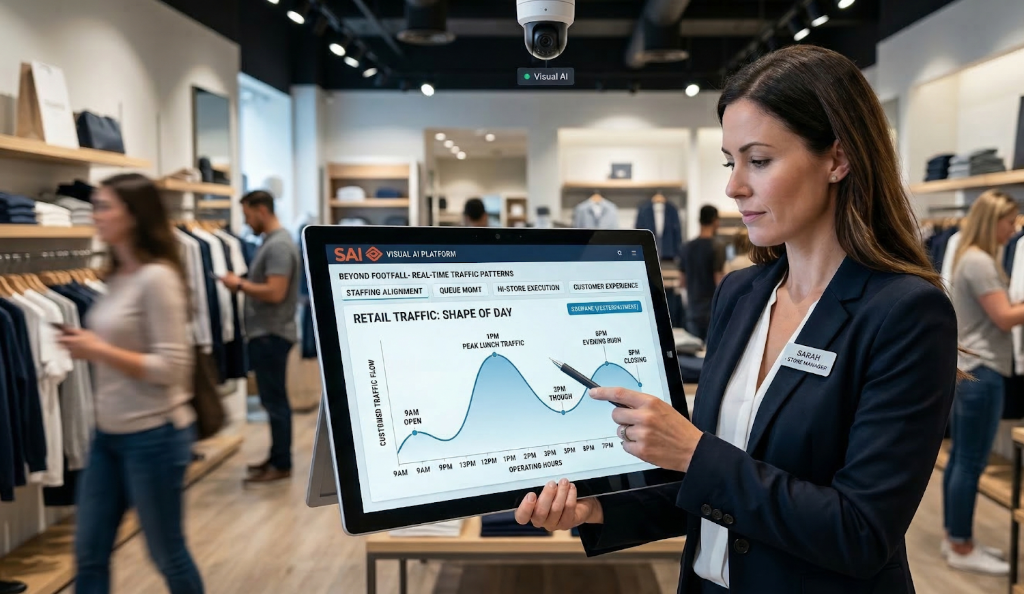
Retail performance is not driven by total footfall alone, but by when customers arrive, how traffic rises and falls during the day, and how those patterns repeat or change over time. The Customer Traffic Shape of Day feature within the SAI Group Visual AI Platform provides retailers with a clear, visual representation of daily customer traffic patterns derived from existing in‑store camera infrastructure.
Rather than focusing solely on aggregate counts, this feature highlights the shape traffic across operating hours—revealing peaks, troughs, and transition periods. By visualizing these patterns, retailers gain a practical foundation for improving staffing alignment, queue management, in‑store execution, and customer experience, while supporting data‑driven operational decisions across single stores or entire estates.
Why the Customer Traffic Shape of Day feature is important for retail stores
Most retail stores already know their busiest hours. However, operational challenges often arise between those known peaks—during ramp‑ups, slowdowns, and unexpected surges. Traditional reporting methods struggle to capture this nuance, leading to:
The Customer Traffic Shape of Day feature addresses this gap by transforming raw camera‑derived traffic data into a continuous, time‑based traffic curve. This aligns with SAI Group’s Store‑Wide Active Intelligence approach, which emphasizes real‑time visibility and actionable operational insight across the entire store, not just at fixed checkpoints like entrances or checkouts.
For store managers and operations leaders, understanding the shape of traffic is critical to delivering consistent customer experiences while controlling labor costs in an environment of rising operational pressure.
How does the customer traffic shape of day feature work?
The Customer Traffic Shape of Day feature builds on SAI Group’s Visual AI platform, which overlays computer vision intelligence on top of existing CCTV camera feeds to monitor in‑store activity.
At a high level, the feature works as follows:
Traffic detection and aggregation
The platform continuously detects and counts customer movement using camera feeds already deployed in the store, avoiding the need for additional hardware investments. This approach is consistent with SAI Group’s focus on scalable, cost‑effective AI deployments in retail environments.
Time‑based pattern formation
Traffic data is aggregated across operating hours to form a visual traffic curve, showing how customer presence builds, peaks, and declines throughout the day. This creates a clear “shape” rather than a static total.
Day‑to‑day and trend comparison
Retailers can compare traffic shapes across different days—such as weekdays versus weekends, promotional periods, or seasonal events—to identify repeatable patterns and anomalies. This supports broader operational analysis alongside other store intelligence signals generated by the platform.
Visualization for operational decision‑making
The resulting traffic shape is presented in an intuitive visual format, making it easier for non‑technical store teams to interpret and act on insights without manual data processing.
Importantly, this feature aligns with SAI Group’s broader philosophy of delivering real‑time, actionable intelligence, rather than passive reporting, to store teams and decision‑makers.
FAQ
No. The Customer Traffic Shape of Day feature leverages existing CCTV camera infrastructure, consistent with SAI Group’s Visual AI deployment model. [linkedin.com]
No. The core value of the feature is the visualization of traffic patterns across the day, not just aggregate footfall numbers.
Store managers, operations teams, and retail leadership all benefit—ranging from daily staffing decisions to longer‑term operational planning.
Basic footfall counting shows how many customers visited. The Customer Traffic Shape of Day shows when and how traffic changes over time, providing deeper operational insight.
Yes. It is one of several capabilities within SAI Group’s Visual AI platform, which delivers store‑wide intelligence for loss prevention, safety, and operational efficiency.