
Journey Statistics
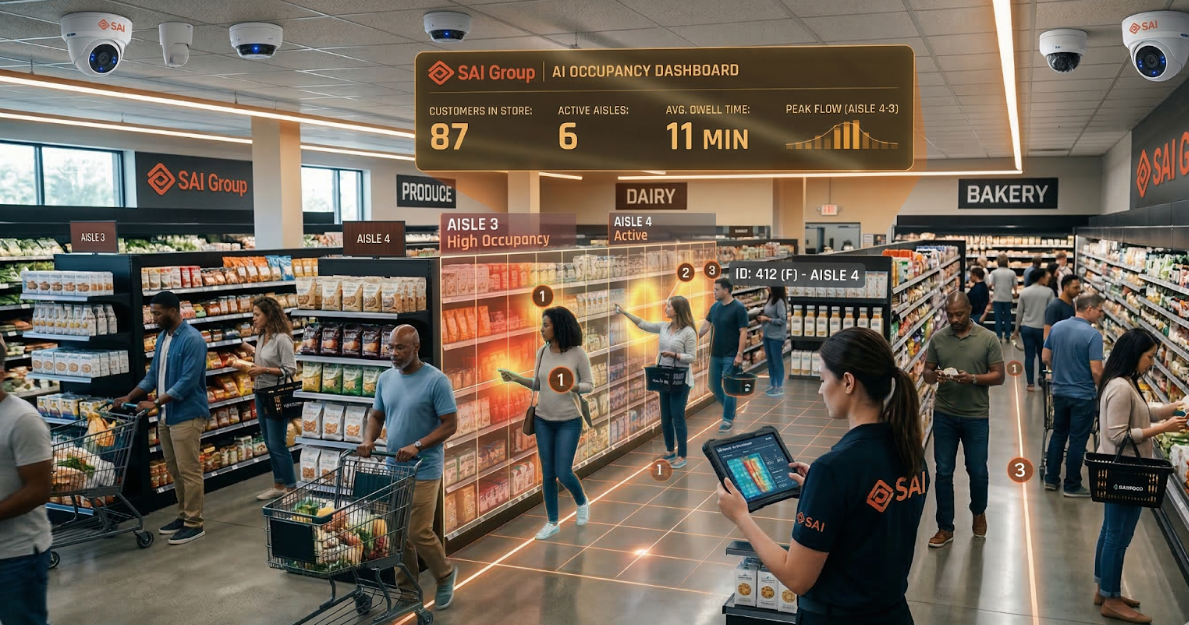
Customers in Store Count
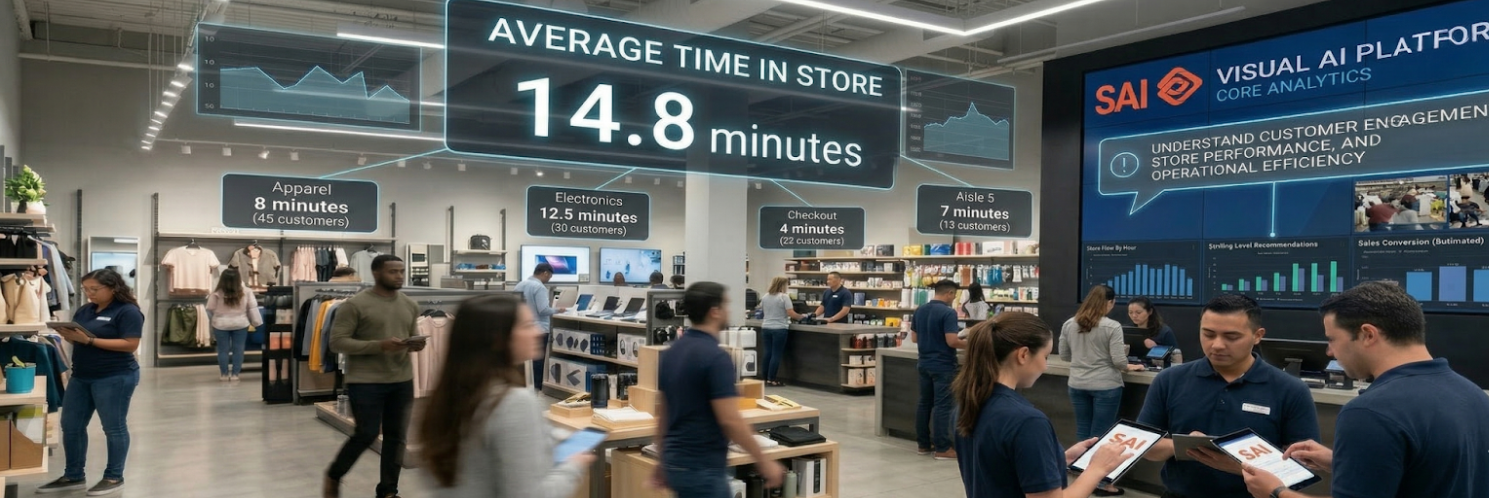
Average Time in Store
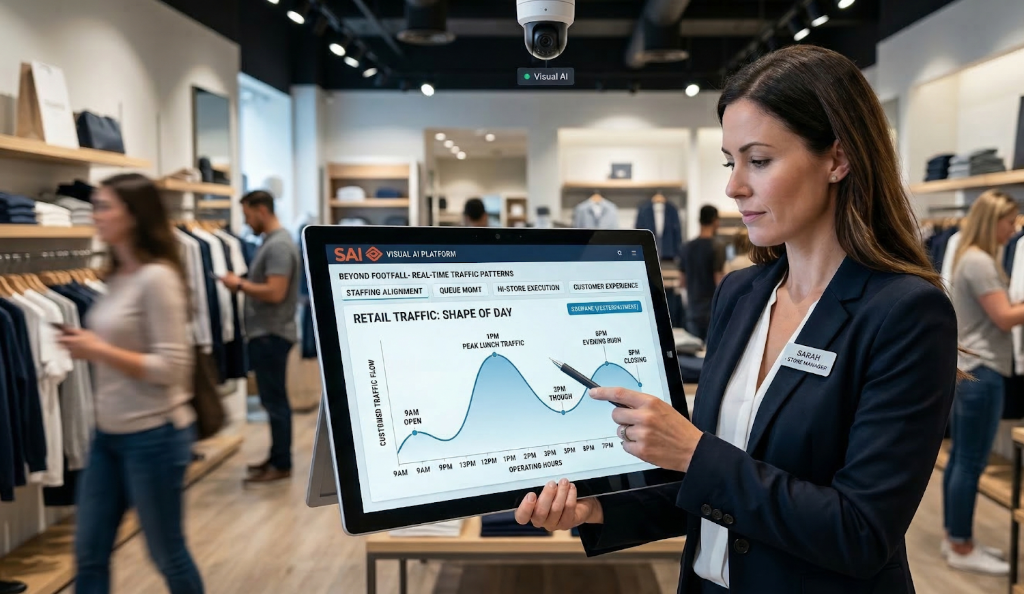
Customer Traffic Shape of Day
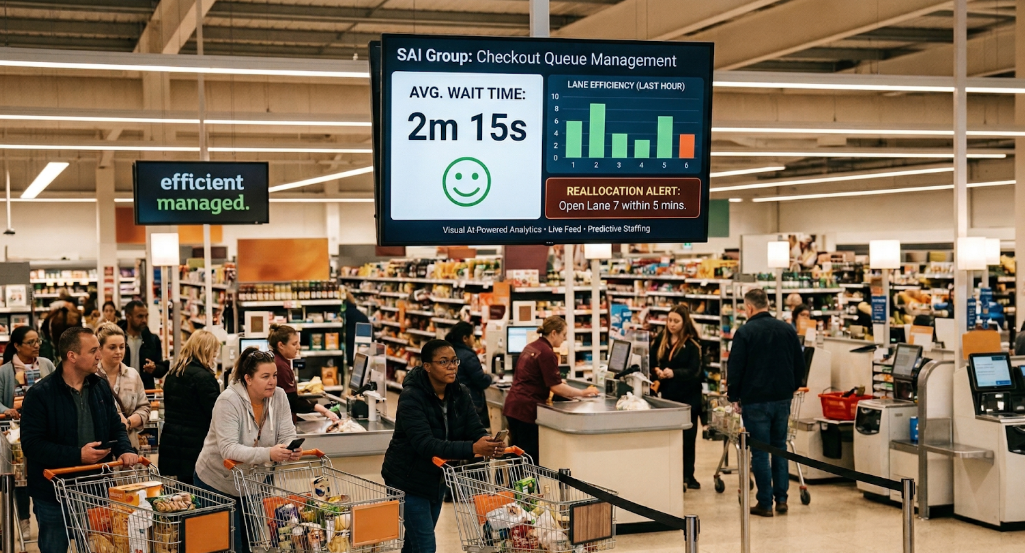
Checkout Queue Time
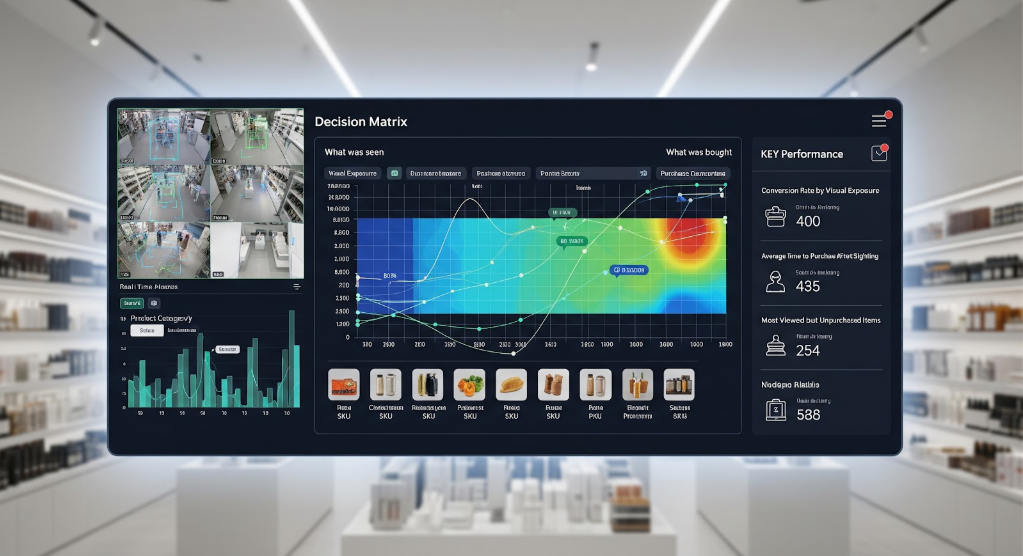
Decision Matrix
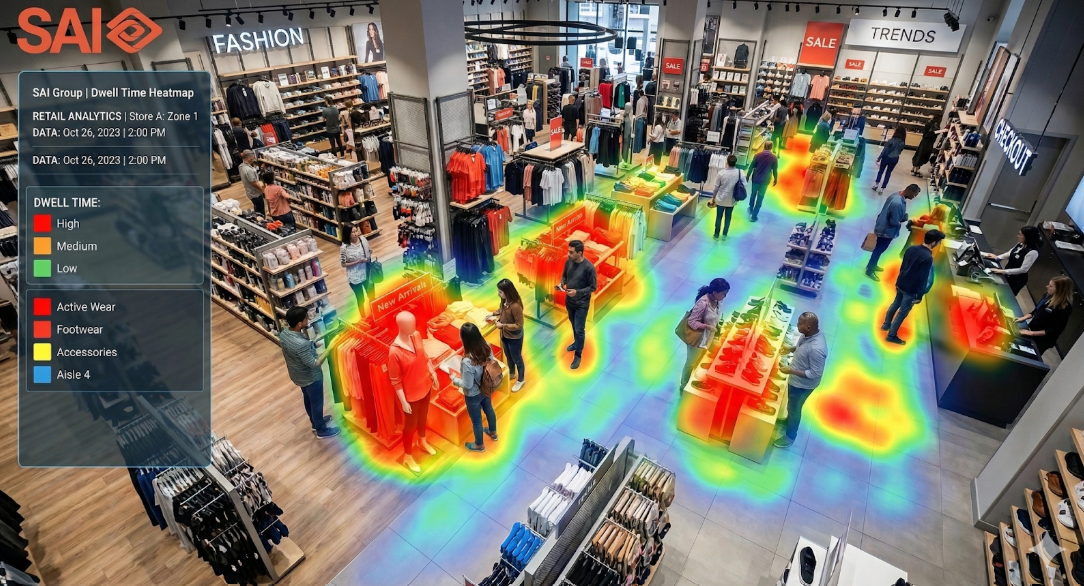
Dwell Time Heatmaps
Protect Changing Area

Service Alerts

Journey Statistics
Detailed view
Retail success today depends not only on what customers buy, but also on how they move through the store before making a purchase. The Journey Statistics feature of SAI Group's Visual AI Platform provides retailers with deep visibility into customer journeys by analyzing the categories and aisles visited during a shopping trip. Powered by computer vision and AI, the feature converts raw in‑store movement into actionable insights that help retailers optimize store layout, improve merchandising effectiveness, and enhance the overall shopping experience.
By identifying high‑traffic categories, common transition paths between aisles, and drop‑off points in shopper journeys, Journey Statistics enables data‑driven decision‑making across merchandising, operations, and marketing teams. The result is a smarter store that aligns better with customer behavior, increases engagement, and ultimately drives higher conversions and revenue.
Why the Journey Statistics feature is important for retail stores
Traditional retail analytics focus heavily on point‑of‑sale data, which only reflects the final outcome of a customer visit. However, a large portion of shopper behavior—browsing, comparisons, hesitation, and abandonment—remains invisible without in‑store journey analysis.
The Journey Statistics feature addresses this gap by answering critical questions such as:
For modern retailers, these insights are essential because:
Journey Statistics transforms physical stores into measurable, optimizable environments, similar to digital channels.
How does the Journey Statistics feature work?
The Journey Statistics feature uses visual AI and computer vision to anonymously analyze shopper movement across the store while maintaining privacy and compliance.
1. Zone and Category Mapping
Retailers define logical zones within the store—such as aisles, departments, or product categories. These zones form the foundation for journey analysis.
2. Visual AI–Based Tracking
AI models detect and track shopper movement across these zones using in‑store cameras. The system focuses on movement patterns, not personal identity, ensuring privacy‑first analytics.
3. Journey Construction
As shoppers move through the store, the platform builds end‑to‑end journeys, capturing:
- Sequence of categories visited
- Time spent in each aisle
- Frequency of transitions between zones
4. Aggregation and Analytics
Individual journeys are aggregated to generate store‑level and category‑level insights, including:
- Most‑visited categories
- Common entry and exit paths
- Popular aisle combinations
- Dwell‑time heat patterns
5. Dashboard and Insights
Insights are presented through intuitive dashboards and reports, allowing stakeholders to quickly interpret trends and identify optimization opportunities.
FAQ
No. The feature analyzes movement patterns anonymously. It does not capture or store personal identity information.
Yes. The platform is designed to integrate with standard in‑store camera setups, minimizing additional hardware requirements.
Footfall analytics measure how many people enter a store or zone. Journey Statistics goes further by analyzing where shoppers go, in what sequence, and for how long.
Yes. The feature enables comparative analysis over time, helping retailers measure the impact of store redesigns, category resets, or promotions.
Merchandising, store operations, marketing, and leadership teams all benefit from journey insights to improve performance across the retail value chain.