
Dwell Time Heatmaps
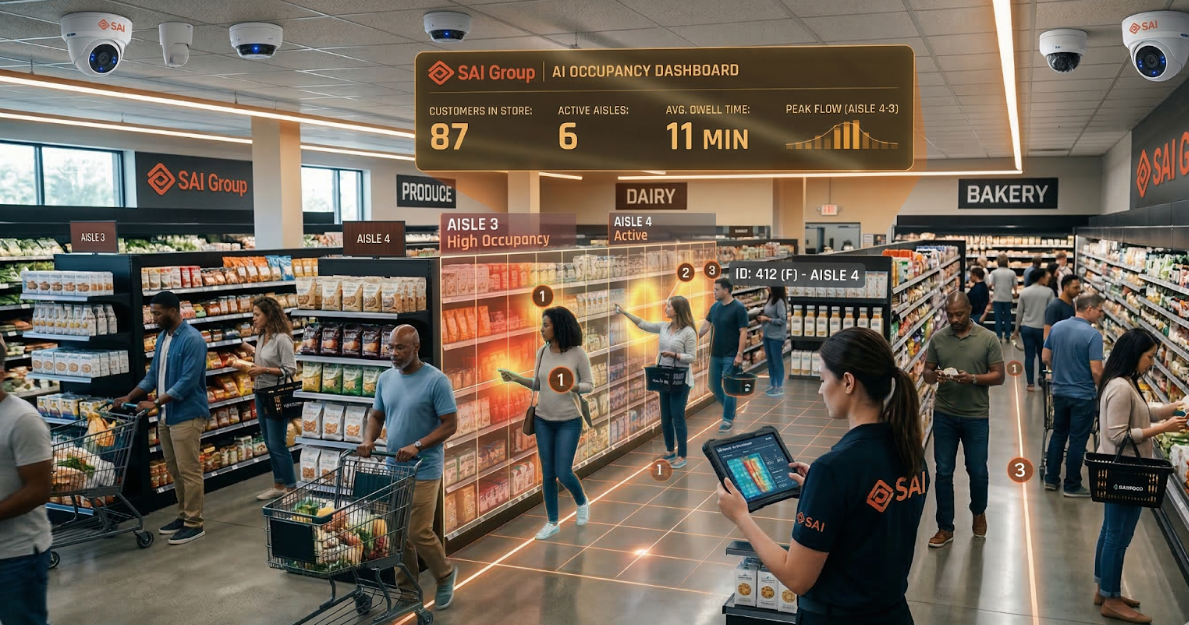
Customers in Store Count
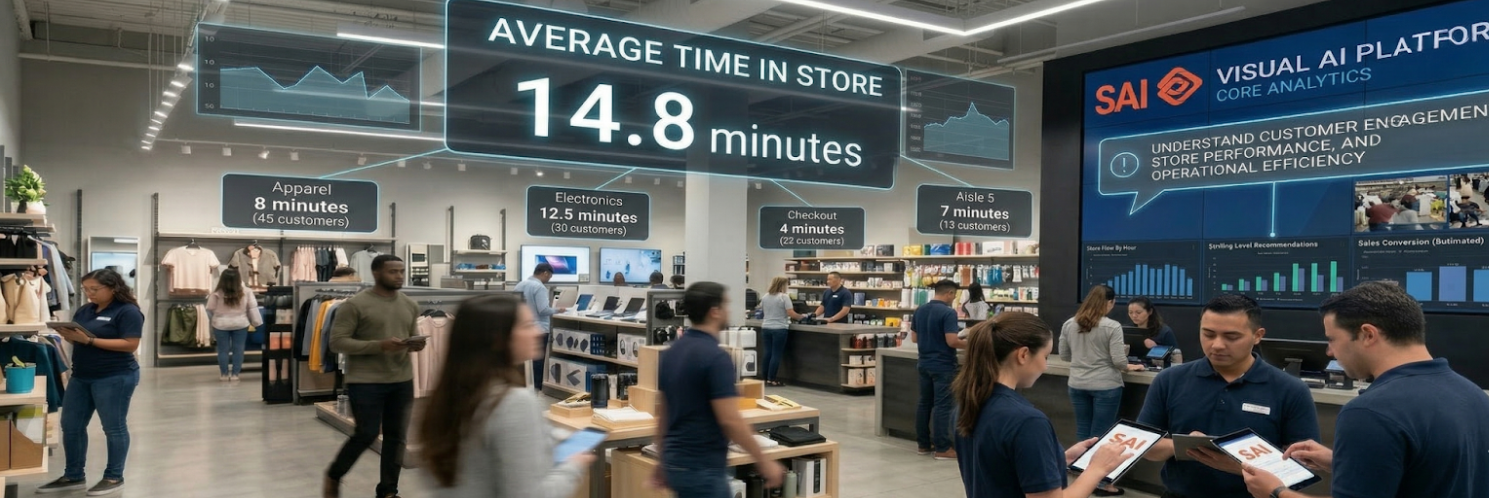
Average Time in Store
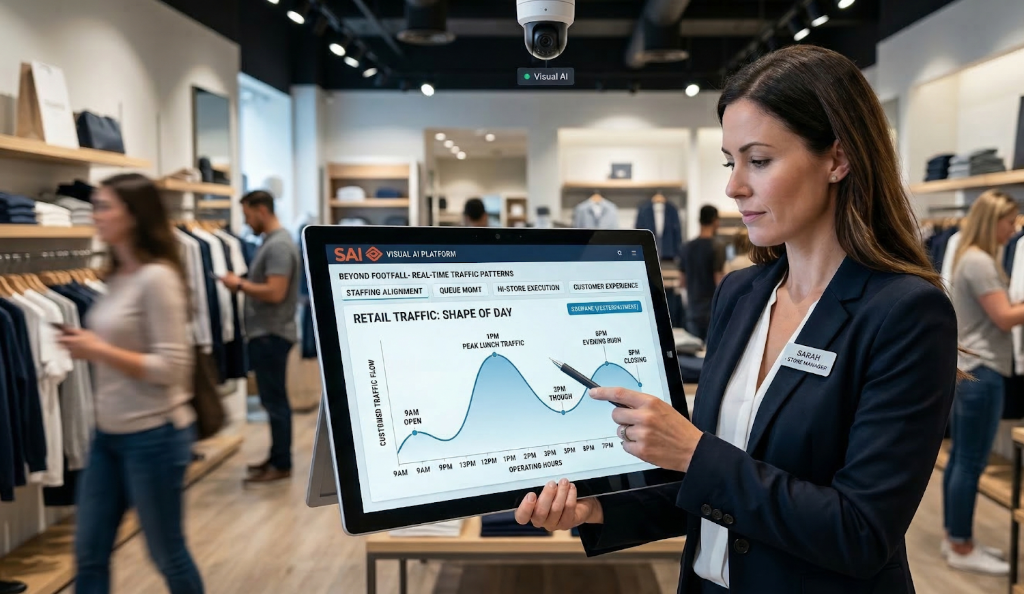
Customer Traffic Shape of Day
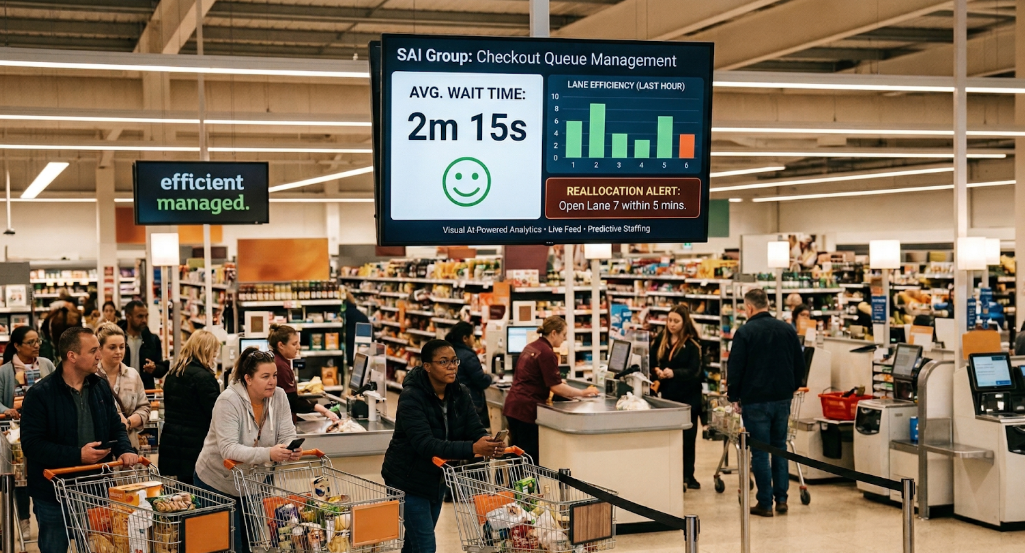
Checkout Queue Time
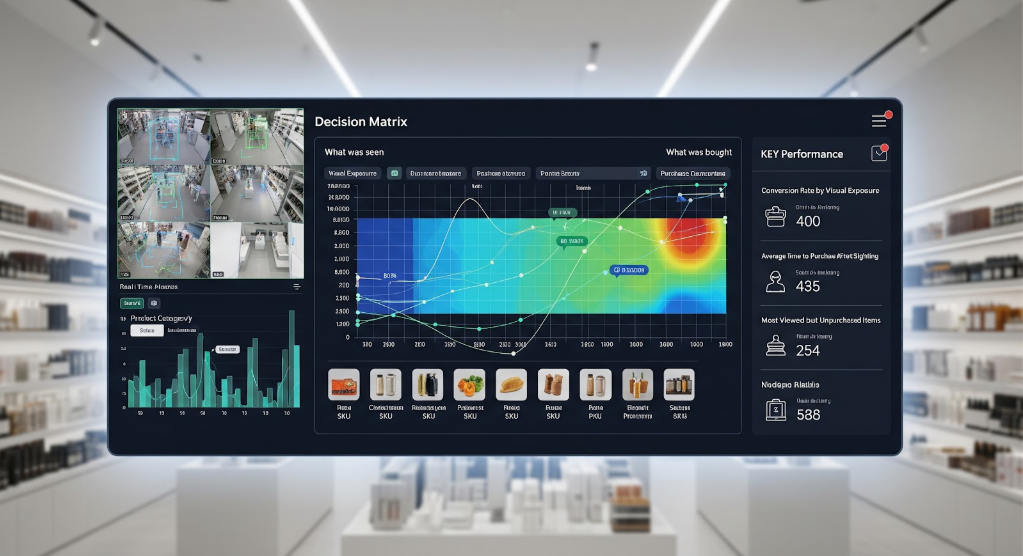
Decision Matrix
Journey Statistics

Protect Changing Area

Service Alerts

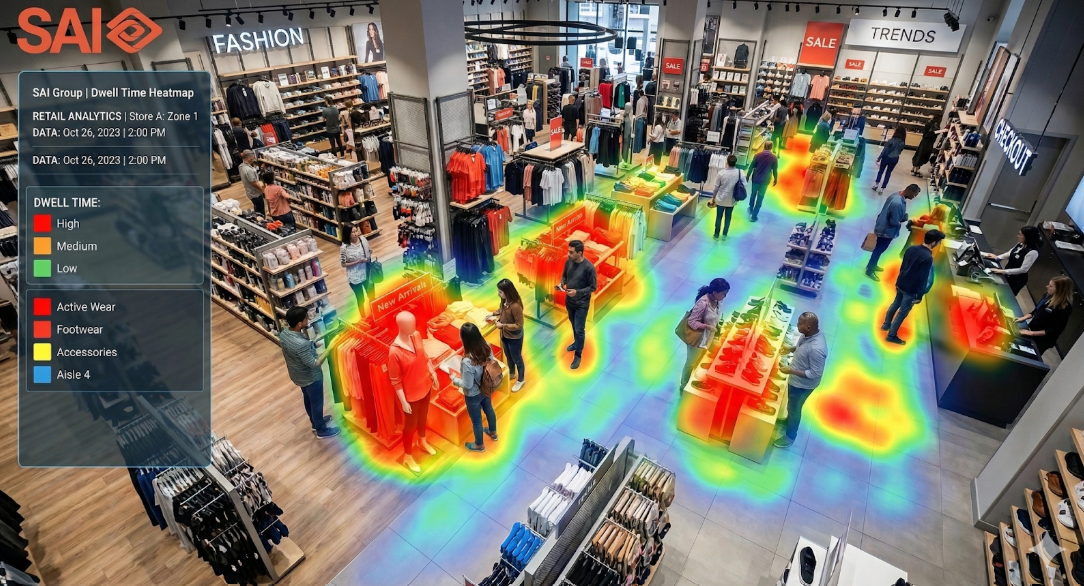
Dwell Time Heatmaps
Detailed view
In today's highly competitive retail environment, understanding how customers interact with physical spaces is just as important as knowing what they buy. The Dwell Time Heatmaps feature in SAI Group's Visual AI platform transforms in‑store video data into intuitive visual insights, revealing where shoppers spend time, how long they stay, and which zones attract the most attention.
By converting raw movement data into color‑coded heatmaps, retailers gain a clear, at‑a‑glance view of customer engagement across store layouts. This enables faster, data‑driven decisions around store design, product placement, promotions, and staffing, ultimately helping retailers increase conversions and improve the overall shopping experience.
Why the Dwell Time Heatmaps feature is important for retail stores
Physical retail has traditionally relied on intuition, manual observation, or periodic surveys to understand shopper behavior. These approaches are often subjective, limited in scale, and difficult to repeat consistently. Dwell Time Heatmaps address these gaps by providing objective, continuous, and visual behavioral data.
Key reasons this feature matters include:
How does the Dwell Time Heatmaps feature work?
The Dwell Time Heatmaps feature leverages computer vision and Visual AI models to analyze video feeds from existing in‑store cameras.
At a high level, the process works as follows:
1. Video capture and anonymized detection
Cameras capture continuous video streams. The Visual AI system detects people as anonymous objects, focusing on movement patterns rather than personal identity.
2. Tracking and time measurement
As shoppers move through the store, the system tracks their position across frames and calculates how long they remain within specific zones or areas.
3. Spatial aggregation
Dwell durations are aggregated over time and mapped to precise floor locations, creating a spatial representation of customer engagement.
4. Heatmap visualization
The aggregated data is rendered as a heatmap overlay on the store layout.
- Warmer colors (for example, red, orange) indicate higher dwell time
- Cooler colors (for example, blue, green) indicate lower dwell time
5. Dashboard and analytics access
Retail teams can view heatmaps through dashboards, filter by time periods (hour, day, week), and compare performance across stores or layouts.
This approach turns complex behavioral data into simple, visual insights that can be understood by both business and operations teams.
FAQ
No. The feature is designed to analyze movement and time spent in areas, not personal identity. It focuses on anonymous behavioral patterns.
In most deployments, Dwell Time Heatmaps can leverage existing camera infrastructure, minimizing the need for additional hardware.
Footfall measures how many people pass through an area, while dwell time measures how long they stay. Dwell time provides deeper insight into engagement and interest.
Yes. Retailers can compare heatmaps across different days, weeks, or campaign periods to measure the impact of layout or merchandising changes.
Common users include merchandising teams, store operations managers, visual merchandising teams, and retail strategy or analytics leaders.