
Decision Matrix
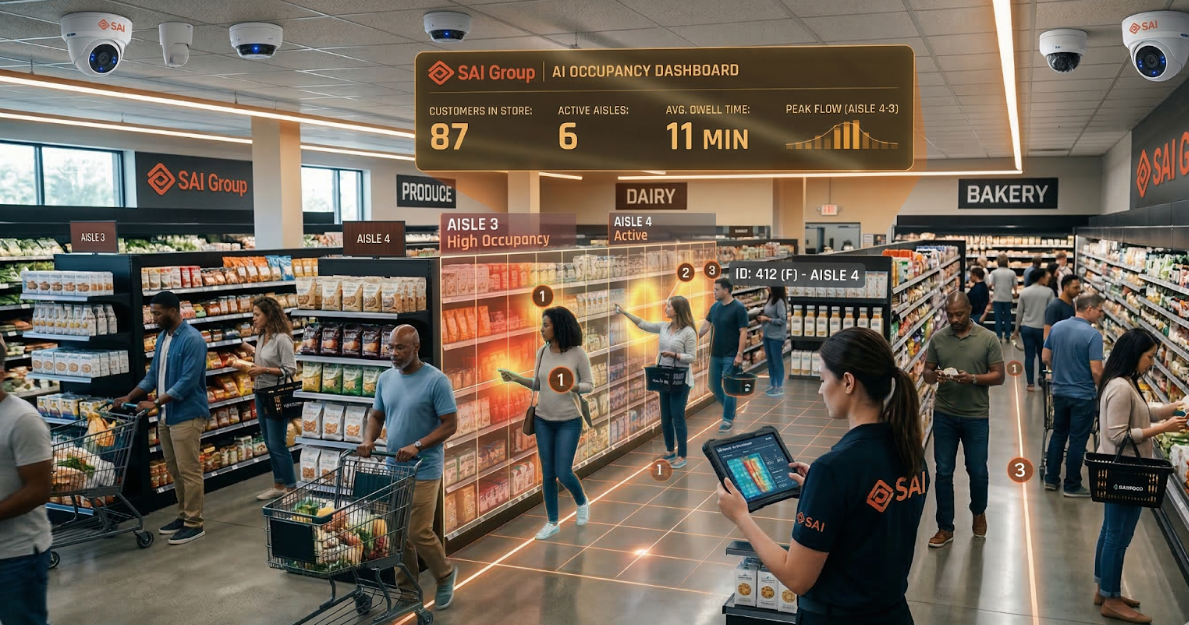
Customers in Store Count
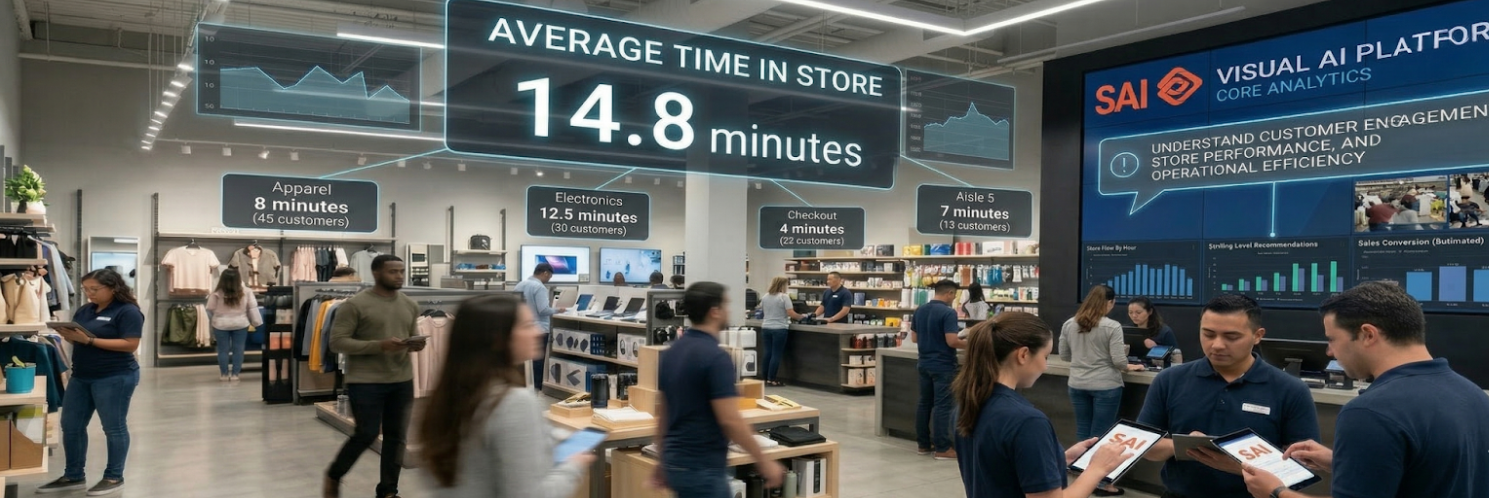
Average Time in Store
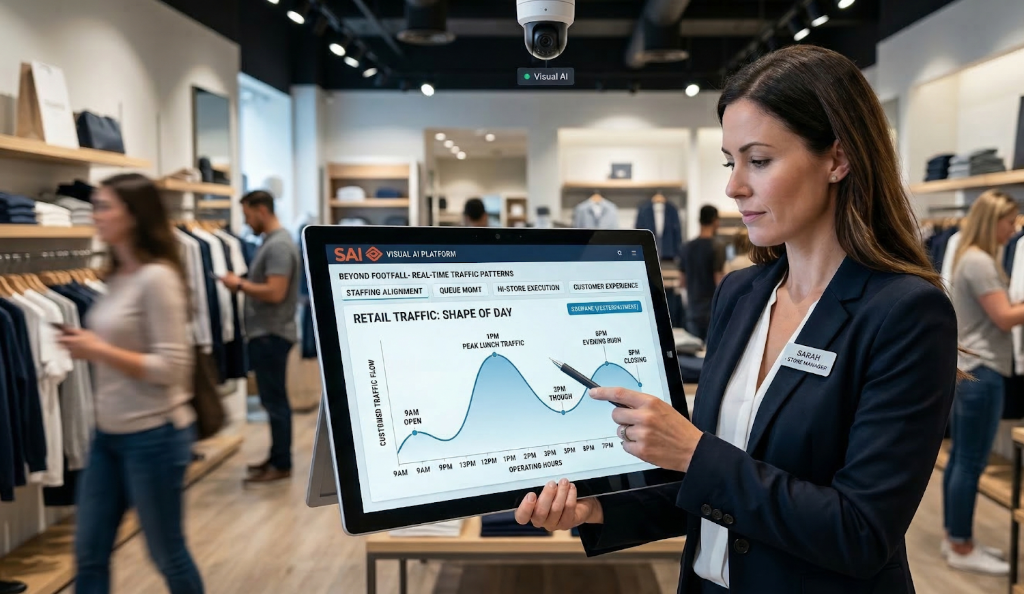
Customer Traffic Shape of Day
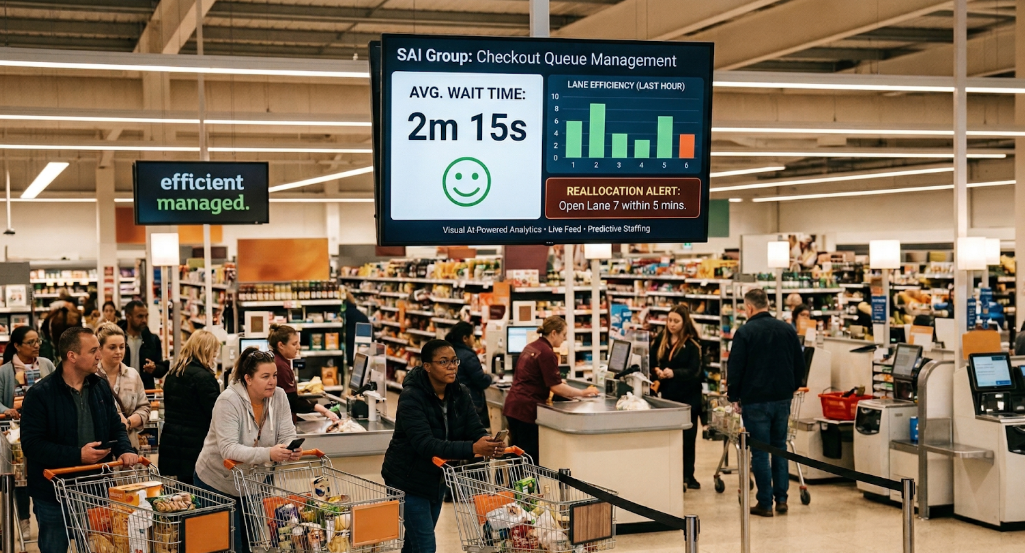
Checkout Queue Time
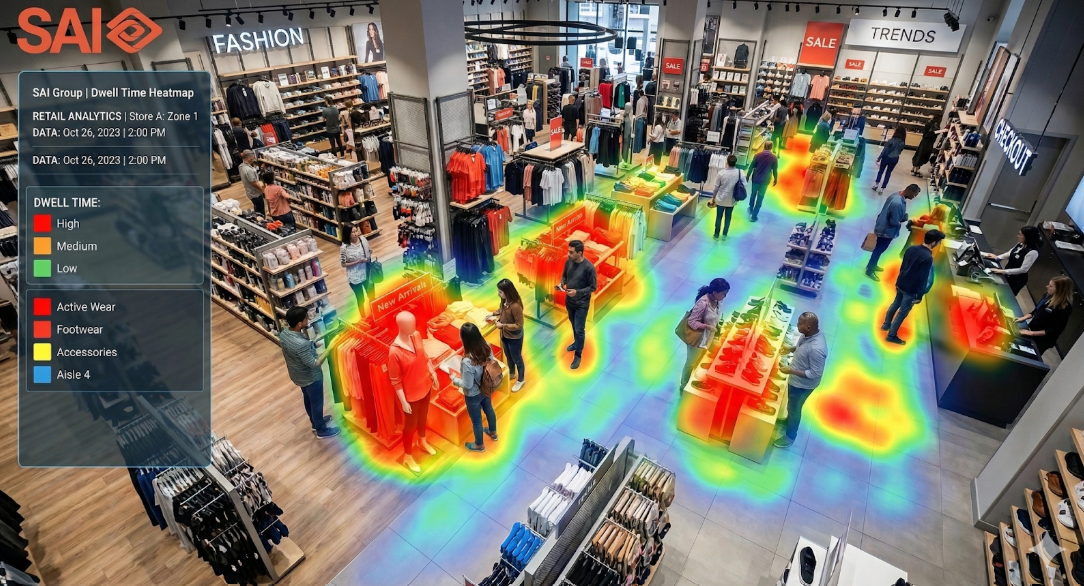
Dwell Time Heatmaps
Journey Statistics

Protect Changing Area

Service Alerts

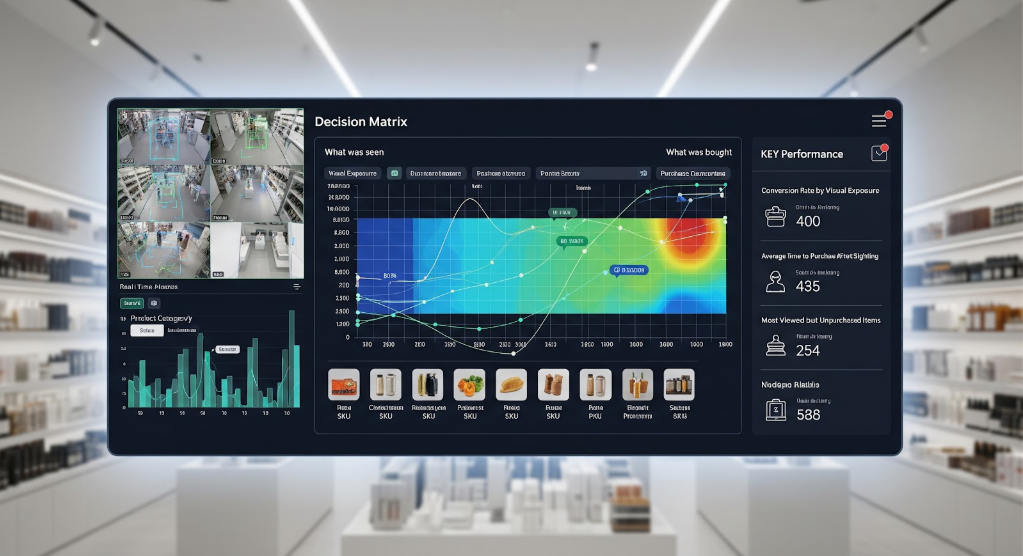
Decision Matrix
Detailed view
Retailers invest heavily in store layout, visual merchandising, and promotions to influence customer choice. Yet a persistent blind spot remains: what customers actually noticed in-store versus what they ultimately purchased. The Decision Matrix feature of SAI Group’s Visual AI platform closes this gap by systematically correlating visual exposure with purchase behavior.
The Decision Matrix transforms in‑store visual data into an intuitive analytical framework that shows how product visibility, shopper attention, and buying decisions interact. By mapping "what was seen" against "what was bought," retailers gain a fact‑based view of product effectiveness, merchandising performance, and missed conversion opportunities. This insight empowers retail teams to move beyond intuition and make data‑driven decisions that improve conversion, optimize shelf space, and increase revenue.
Why the Decision Matrix feature is important for retail stores
Modern retail environments are complex. Shoppers are exposed to hundreds or thousands of products in a single visit, but only a fraction of those products meaningfully influence purchasing decisions. Traditional sales reports reveal what sold, but not why it sold—or why other products did not.
The Decision Matrix is important because it helps retailers:
In essence, the Decision Matrix converts in‑store shopper behavior into a measurable, actionable performance signal.
How does the Decision Matrix feature work?
The Decision Matrix works by combining visual perception data with transactional purchase data into a single analytical view.
Capturing What Customers Saw
Using SAI Group's Visual AI capabilities, the platform identifies which products, categories, or displays were visually present to shoppers during their in‑store journey. This includes factors such as:
- Product presence on shelves or displays
- Relative visibility within the shopper's field of view
- Frequency and duration of exposure
This creates a reliable proxy for visual attention—what customers realistically had the opportunity to notice.
Linking Visual Exposure to Purchases
The platform then correlates this visual exposure data with sales transactions from the same store and time period. This step connects attention with outcome, allowing each product to be evaluated based on both dimensions.
Classifying Outcomes in a Decision Matrix
Products are plotted into a simple matrix that compares:
- Seen vs. Not Seen
- Bought vs. Not Bought
This classification highlights distinct performance patterns, such as:
- Products that were seen and bought
- Products that were seen but not bought
- Products that were not prominently seen but still bought
Interpreting the Results
Each quadrant of the matrix tells a different story, helping retailers understand whether issues stem from visibility, pricing, assortment relevance, or conversion effectiveness. The result is a clear, visual decision‑support tool that guides next actions.
FAQ
No. The matrix is designed to be intuitive and visual, making it easy for both store managers and central teams to understand performance patterns at a glance.
No. It complements existing reports by adding critical behavioral context—explaining why sales outcomes occur, not just what happened.
Yes. The framework is scalable and can be applied at store, cluster, or network level to identify both local and systemic patterns.
The frequency depends on data availability and deployment configuration, but the design supports continuous performance monitoring rather than one‑time analysis.
Merchandising teams, category managers, store operations leaders, and retail leadership all benefit by gaining a shared, data‑driven understanding of shopper behavior.